What an energy finding looks like
Follow one finding from the meter data to the change on site: what the pattern shows, how the cause is checked and what the record contains.
1 · The observation
A store that never switches off
One week of electricity use at a single store, compared with the kWIQly model of what the store should use.
- Measured load
- Expected load (model)
- Above the model while closed
Swipe to see the whole week →
The store closes at 20:00. The model expects load to fall to about 6 kW for refrigeration and security lighting.
Measured load stays near 15 kW all night. The same happens every night of the week.
On Sunday the store is closed all day and the load is the same, so late trading does not explain it.
2 · The check
- 01
Rule out the obvious
- ✓Ask the store manager about night cleaning, deliveries and late trading.
- ✓None of them explains the load in this example.
- 02
Find the cause
- ✓Facilities reviews the lighting and air-handling schedules.
- ✓Both were left running 24/7 after a controller was replaced.
- 03
Make the change
- ✓The regional facilities team restores the schedule, keeping refrigeration and security lighting on.
- ✓The date of the change is recorded.
3 · The action record
The same comparison, for every meter in your portfolio
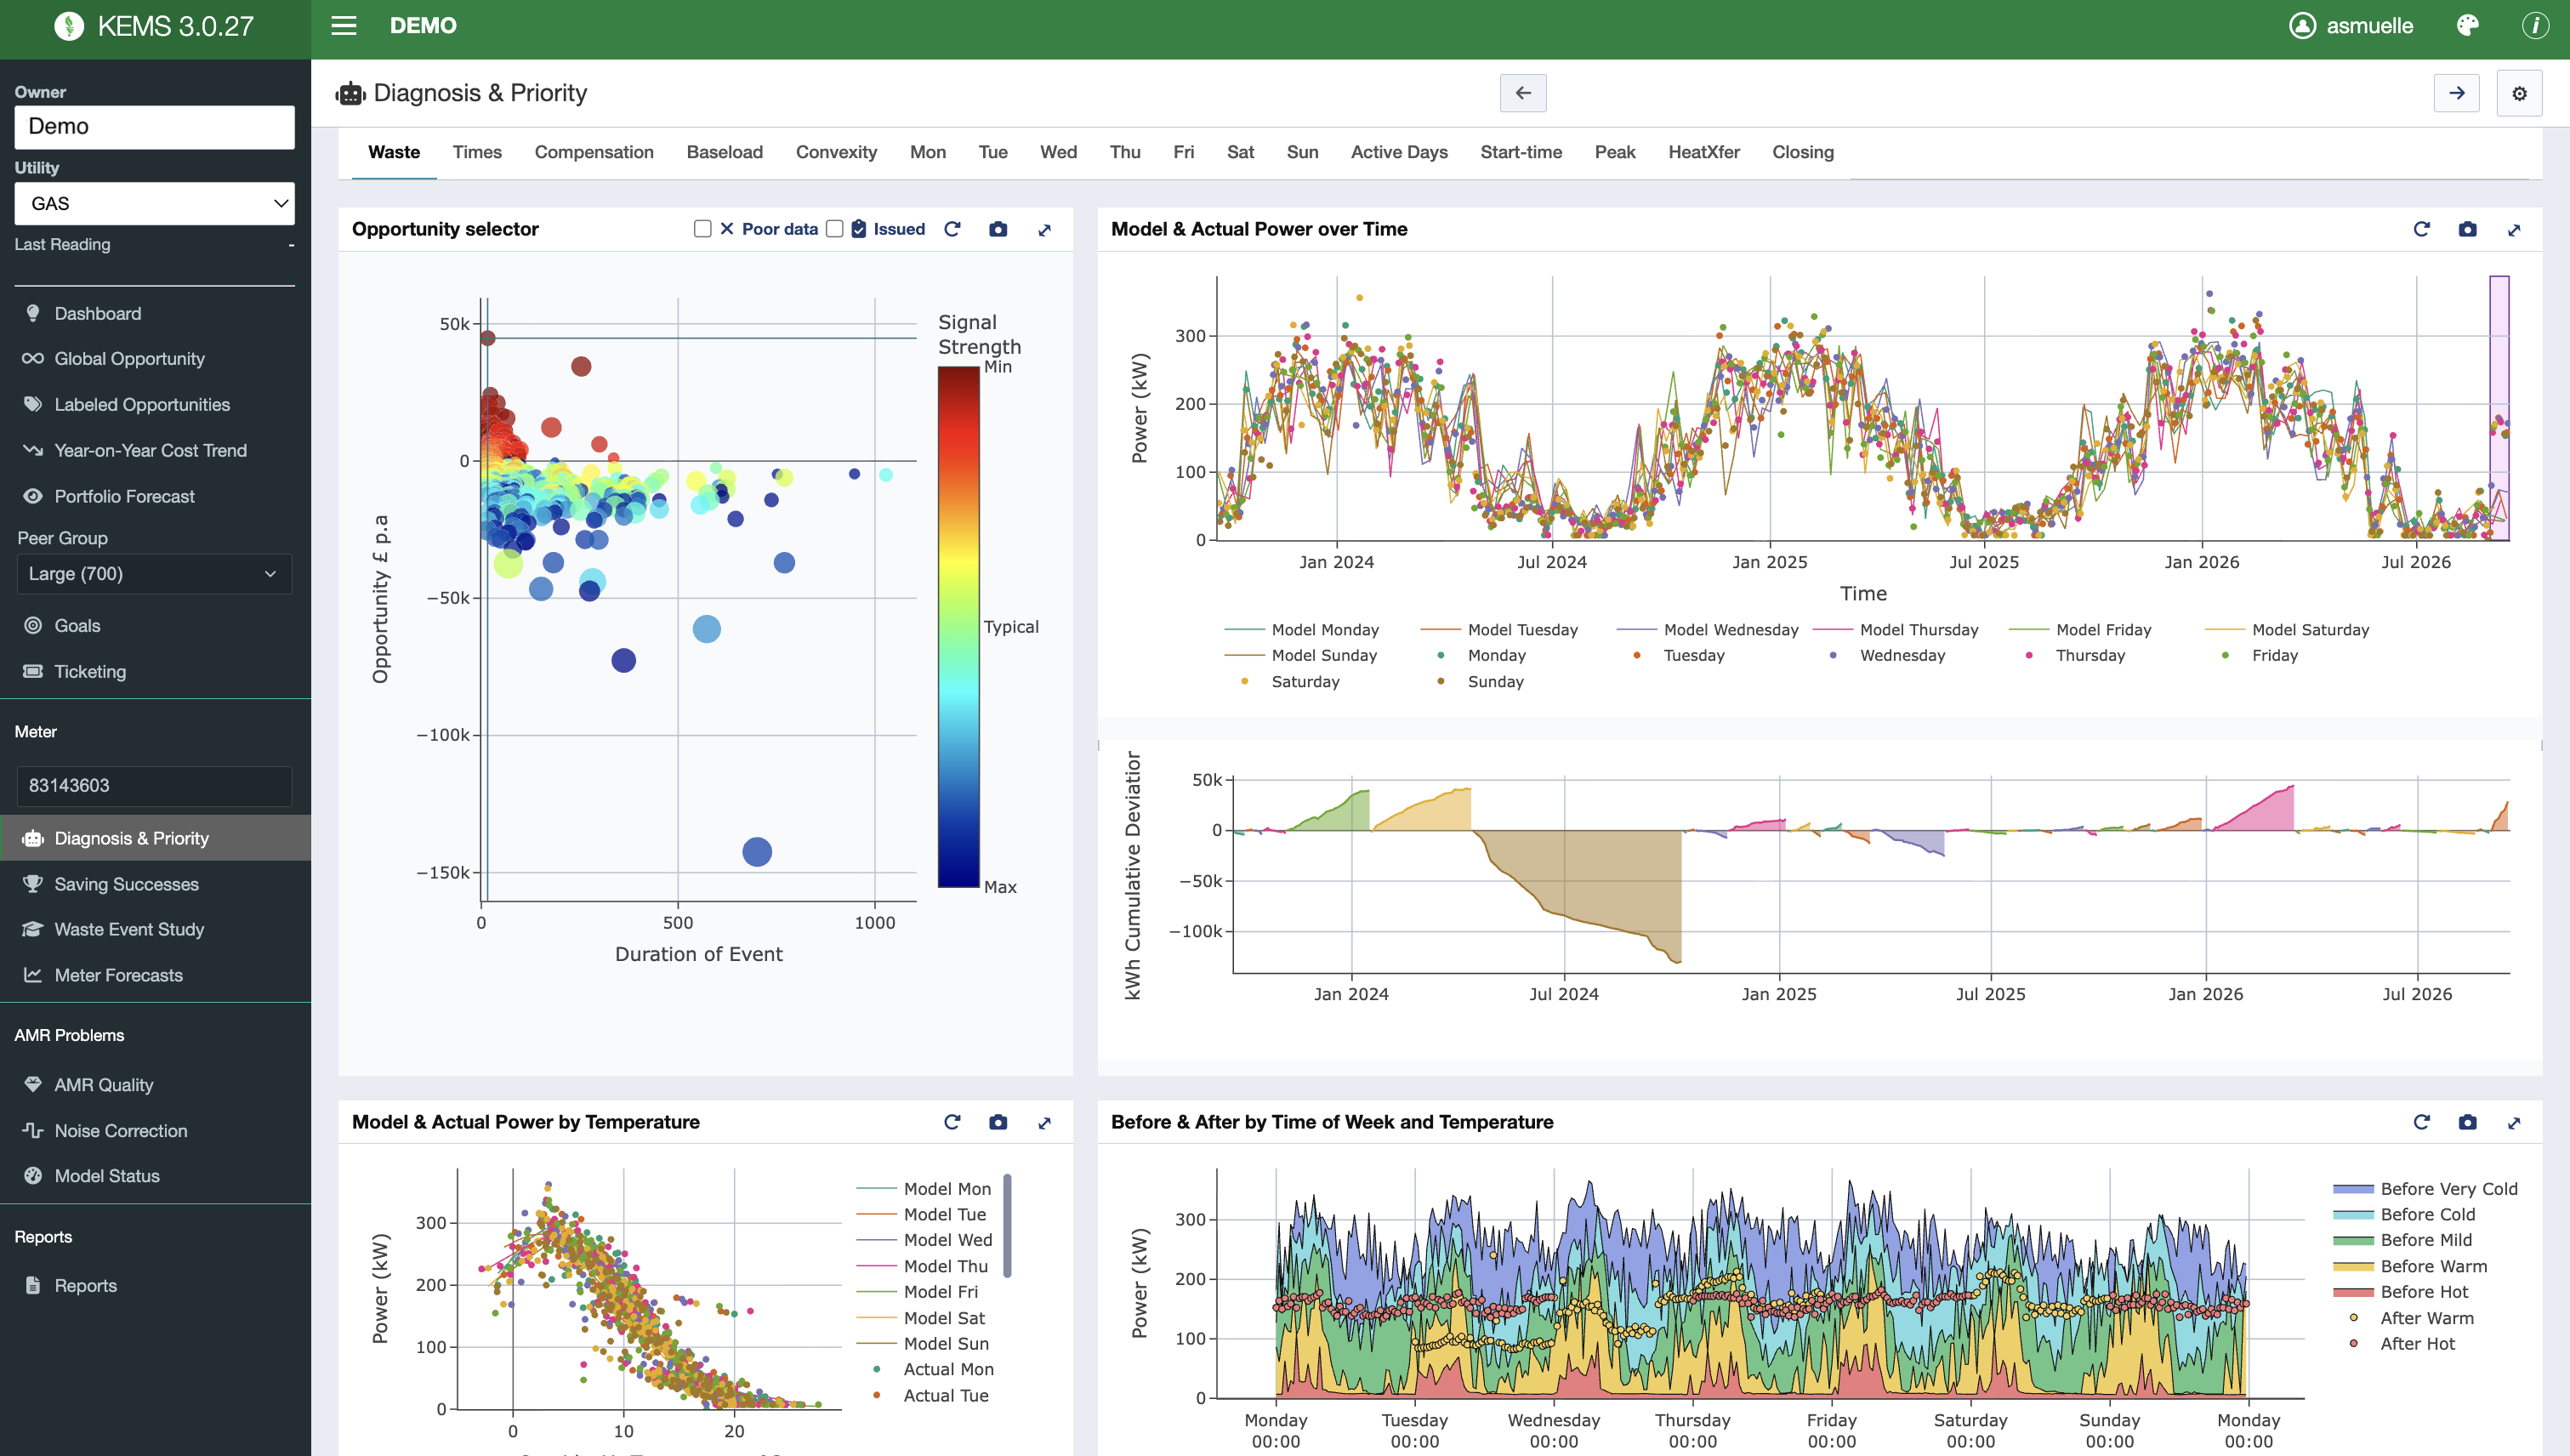
kWIQly runs this comparison for every meter and ranks the results, so your team starts with the largest, clearest findings.
01
Identify a pattern worth investigating.
Existing platform view. The figures shown are not a savings forecast for your portfolio.
Find your next opportunities to save
Tell us about your portfolio. We will reply within one working day to discuss your data and the next step.